Sankt Leonhard im Pitztal
St. Leonhard im Pitztal | |
|---|---|
 | |
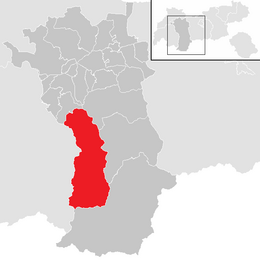
 Location in the district | |
| Coordinates: 47°04′00″N 10°50′00″E / 47.06667°N 10.83333°E | |
| Country | Austria |
| State | Tyrol |
| District | Imst |
| Government | |
| • Mayor | Rupert Hosp |
| Area | |
| • Total | 223.53 km2 (86.31 sq mi) |
| Elevation | 1,366 m (4,482 ft) |
| Population (2018-01-01)[2] | |
| • Total | 1,382 |
| • Density | 6.2/km2 (16/sq mi) |
| Time zone | UTC+1 (CET) |
| • Summer (DST) | UTC+2 (CEST) |
| Postal code | 6481 |
| Area code | 05413 |
| Vehicle registration | IM |
| Website | www.st-leonhard.tirol.gv.at |
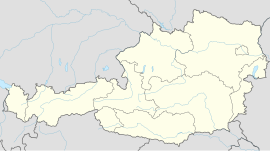
Sankt Leonhard im Pitztal is a municipality in the Imst district, located 20 kilometres (12 mi) south of Imst on the upper course of the Pitze River in western Austria. The village covers a large area and has a length of around 25 kilometres (16 mi). It is one of the biggest communities of Tyrol by area.

The climate is severe because of mountain flanks. The area was founded around 1300, and its main source of income is tourism.

Climate
| Climate data for St.Leonhard Pitztal: 1454m (1991−2020) | |||||||||||||
|---|---|---|---|---|---|---|---|---|---|---|---|---|---|
| Month | Jan | Feb | Mar | Apr | May | Jun | Jul | Aug | Sep | Oct | Nov | Dec | Year |
| Record high °C (°F) | 11.7 (53.1) |
13.4 (56.1) |
18.8 (65.8) |
21.6 (70.9) |
25.8 (78.4) |
31.2 (88.2) |
30.3 (86.5) |
29.3 (84.7) |
24.8 (76.6) |
22.3 (72.1) |
19.2 (66.6) |
12.3 (54.1) |
31.2 (88.2) |
| Mean daily maximum °C (°F) | 0.9 (33.6) |
2.7 (36.9) |
6.0 (42.8) |
10.1 (50.2) |
14.3 (57.7) |
18.2 (64.8) |
19.3 (66.7) |
18.8 (65.8) |
15.3 (59.5) |
11.1 (52.0) |
5.5 (41.9) |
1.3 (34.3) |
10.3 (50.5) |
| Daily mean °C (°F) | −4.7 (23.5) |
−3.7 (25.3) |
0.2 (32.4) |
4.0 (39.2) |
8.6 (47.5) |
12.0 (53.6) |
13.8 (56.8) |
13.4 (56.1) |
9.5 (49.1) |
5.5 (41.9) |
0.3 (32.5) |
−3.8 (25.2) |
4.6 (40.3) |
| Mean daily minimum °C (°F) | −9.5 (14.9) |
−10.2 (13.6) |
−5.4 (22.3) |
−1.8 (28.8) |
2.4 (36.3) |
5.8 (42.4) |
7.4 (45.3) |
7.3 (45.1) |
4.0 (39.2) |
0.1 (32.2) |
−4.5 (23.9) |
−8.0 (17.6) |
−1.0 (30.1) |
| Record low °C (°F) | −23.6 (−10.5) |
−28.4 (−19.1) |
−25.2 (−13.4) |
−15.9 (3.4) |
−6.8 (19.8) |
−2.7 (27.1) |
−0.5 (31.1) |
−1.0 (30.2) |
−5.3 (22.5) |
−14.2 (6.4) |
−18.4 (−1.1) |
−22.3 (−8.1) |
−28.4 (−19.1) |
| Source: Central Institute for Meteorology and Geodynamics[3] | |||||||||||||

Population
| Year | Pop. | ±% |
|---|---|---|
| 1869 | 1,147 | — |
| 1880 | 1,057 | −7.8% |
| 1890 | 1,039 | −1.7% |
| 1900 | 986 | −5.1% |
| 1910 | 1,032 | +4.7% |
| 1923 | 932 | −9.7% |
| 1934 | 983 | +5.5% |
| 1939 | 989 | +0.6% |
| 1951 | 1,042 | +5.4% |
| 1961 | 1,150 | +10.4% |
| 1971 | 1,224 | +6.4% |
| 1981 | 1,299 | +6.1% |
| 1991 | 1,404 | +8.1% |
| 2001 | 1,472 | +4.8% |
| 2011 | 1,463 | −0.6% |
References
- ^ "Dauersiedlungsraum der Gemeinden Politischen Bezirke und Bundesländer - Gebietsstand 1.1.2018". Statistics Austria. Retrieved 10 March 2019.
- ^ "Einwohnerzahl 1.1.2018 nach Gemeinden mit Status, Gebietsstand 1.1.2018". Statistics Austria. Retrieved 9 March 2019.
- ^ "Klimamittelwerte 1991-2020" (in German). Central Institute for Meteorology and Geodynamics. Retrieved 21 August 2023.
External links
- www.st-leonhard.tirol.gv.at - city website

See what we do next...
OR
By submitting your email or phone number, you're giving mschf permission to send you email and/or recurring marketing texts. Data rates may apply. Text stop to cancel, help for help.
Success: You're subscribed now !


