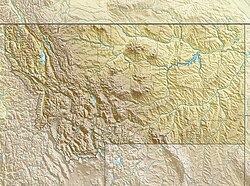
Snowshoe Peak
| Snowshoe Peak | |
|---|---|
 Snowshoe Peak from Leigh Lake | |
| Highest point | |
| Elevation | 8,738 ft (2,663 m)[1] |
| Prominence | 5,418 ft (1,651 m)[1] |
| Listing | |
| Coordinates | 48°13′23″N 115°41′22″W / 48.22306°N 115.68944°W |
| Geography | |
| Location | Cabinet Mountains Wilderness, Lincoln / Sanders counties, Montana, U.S. |
| Parent range | Cabinet Mountains |
| Topo map | USGS Snowshoe Peak |
| Climbing | |
| Easiest route | West approach (Class 3), though the standard route (northeast ridge) is shorter [2][3] |
Snowshoe Peak is a mountain in the U.S. state of Montana. At 8,738 ft (2,663 m), it is the highest peak in the Cabinet Mountains of Northwestern Montana and Idaho.

Climate
| Climate data for Snowshoe Peak 48.2343 N, 115.6985 W, Elevation: 8,051 ft (2,454 m) (1991–2020 normals) | |||||||||||||
|---|---|---|---|---|---|---|---|---|---|---|---|---|---|
| Month | Jan | Feb | Mar | Apr | May | Jun | Jul | Aug | Sep | Oct | Nov | Dec | Year |
| Mean daily maximum °F (°C) | 23.4 (−4.8) |
23.8 (−4.6) |
27.4 (−2.6) |
34.2 (1.2) |
43.5 (6.4) |
50.8 (10.4) |
61.7 (16.5) |
62.3 (16.8) |
53.9 (12.2) |
40.3 (4.6) |
27.6 (−2.4) |
22.2 (−5.4) |
39.3 (4.0) |
| Daily mean °F (°C) | 18.0 (−7.8) |
17.3 (−8.2) |
20.0 (−6.7) |
25.6 (−3.6) |
34.3 (1.3) |
41.0 (5.0) |
50.5 (10.3) |
50.6 (10.3) |
42.9 (6.1) |
31.9 (−0.1) |
22.3 (−5.4) |
17.1 (−8.3) |
31.0 (−0.6) |
| Mean daily minimum °F (°C) | 12.7 (−10.7) |
10.9 (−11.7) |
12.6 (−10.8) |
16.9 (−8.4) |
25.1 (−3.8) |
31.2 (−0.4) |
39.3 (4.1) |
39.0 (3.9) |
32.0 (0.0) |
23.6 (−4.7) |
17.0 (−8.3) |
11.9 (−11.2) |
22.7 (−5.2) |
| Average precipitation inches (mm) | 11.95 (304) |
9.75 (248) |
10.23 (260) |
7.10 (180) |
6.70 (170) |
6.56 (167) |
1.79 (45) |
1.69 (43) |
4.48 (114) |
8.59 (218) |
12.42 (315) |
11.32 (288) |
92.58 (2,352) |
| Source: PRISM Climate Group[4] | |||||||||||||
See also
References
- ^ a b "America's 57 - the Ultras". Peaklist.org. Retrieved 2013-02-02.
- ^ "Snowshoe Peak" Summitpost.org. Retrieved 2013-02-02.
- ^ "Northeast Ridge" Summitpost.org. Retrieved 2013-02-02.
- ^ "PRISM Climate Group, Oregon State University". PRISM Climate Group, Oregon State University. Retrieved October 4, 2023.
To find the table data on the PRISM website, start by clicking Coordinates (under Location); copy Latitude and Longitude figures from top of table; click Zoom to location; click Precipitation, Minimum temp, Mean temp, Maximum temp; click 30-year normals, 1991-2020; click 800m; click Retrieve Time Series button.
External links

See what we do next...
OR
By submitting your email or phone number, you're giving mschf permission to send you email and/or recurring marketing texts. Data rates may apply. Text stop to cancel, help for help.
Success: You're subscribed now !

